Introduction
Recent advances on protein modeling and docking tools have lead to the production of many structural models for protein folds and protein-protein interactions (PPIs). Therefore, to identify which models are the closest to the native conformation has become crucial for structure prediction. The SPServer uses knowledge-based potentials to evaluate the accuracy of models of protein folds and PPIs. Knowledge-based potentials are scoring functions that represent the properties from a set of known structures. Depending on whether the evaluated model is from a protein fold or from a PPI, different potentials will be used. Knowledge-based potentials can be used with many different purposes: discriminate the correct fold of proteins, predict the stability of mutant proteins, analyze and assess outcomes of docking experiments or evaluate the effect of mutations on protein-protein interactions. Each one of these purposes is explained in detail in the server tutorial section.
The method
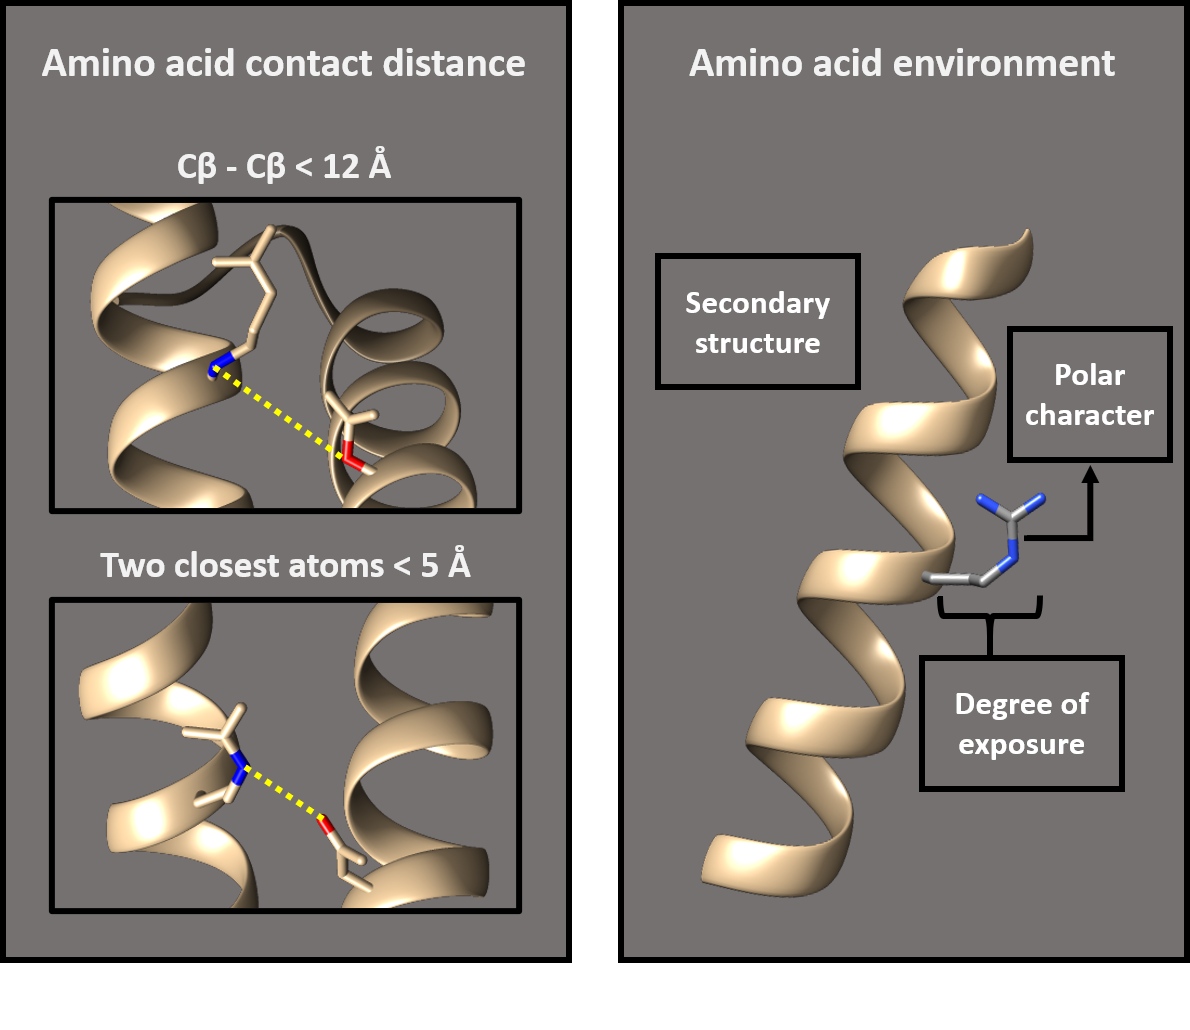
A knowledge-based potential is an energy function derived from the analysis of a reference set of known protein structures. This function will provide good scores for the protein models that have similar structural properties to the ones in the reference set. According to the type of input, a protein model or a PPI model, the used potentials will be computed from a set of protein structures or PPI structures, respectively. This function is based on the frequencies of amino acid contacts in this set of known structures. We have two different criteria to define an amino acid contact:
- When the distance between the two CΒ is less than 12 Angtroms.
- When the distance between any atom in the two amino acids is less than 5 Angtroms.
Potentials considering each contact definition have been computed and you can choose which to use in the server menu. Furthermore, the potentials between amino acid pairs are split by considering different environmental features:
- Polar character
- Secondary structure
- Exposure degree
Definitions of amino acid contact / Amino acid environmental features
We have designed different knowledge-based potentials depending on which of these environmental features we take into account for the contact definition. These knowledge-based potentials are:
- PAIR: Considers amino acid frequencies along distances.
- ES3DC: Considers residue frequencies along distances and their environments (i.e. hydrophobicity of each amino acid, solvent accessibility and secondary structure).
- ELOCAL: Considers amino acid frequencies on a particular environment.
- E3DC: Considers frequencies along distances of pairs referred by the hydrophobicity of the amino acids and the rest of their environments
- E3D: Considers the frequencies of any pair of residues along distances.
- ECOMB: Combines ES3DC, ELOCAL and E3DC scores.
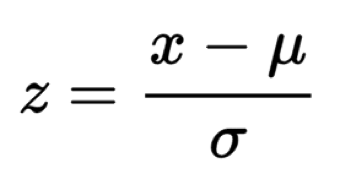
Also, Z-scores are provided for each one of these potentials scoring functions. The background distribution to obtain these Z-scores is obtained by shuffling the sequences of the protein (or proteins) in the structure that will be scored. The Z-score formula can be seen here:
The mathematics of the SPServer potentials
The Split-Statistical Potentials have been defined in previous works (1,2) using the description of a potential of mean force (PMF), say the features describing an amino acid are defined by θ, with θ=(secondary structure, polar character, degree of exposure). Then we define the potentials as in equations 1 to 5:
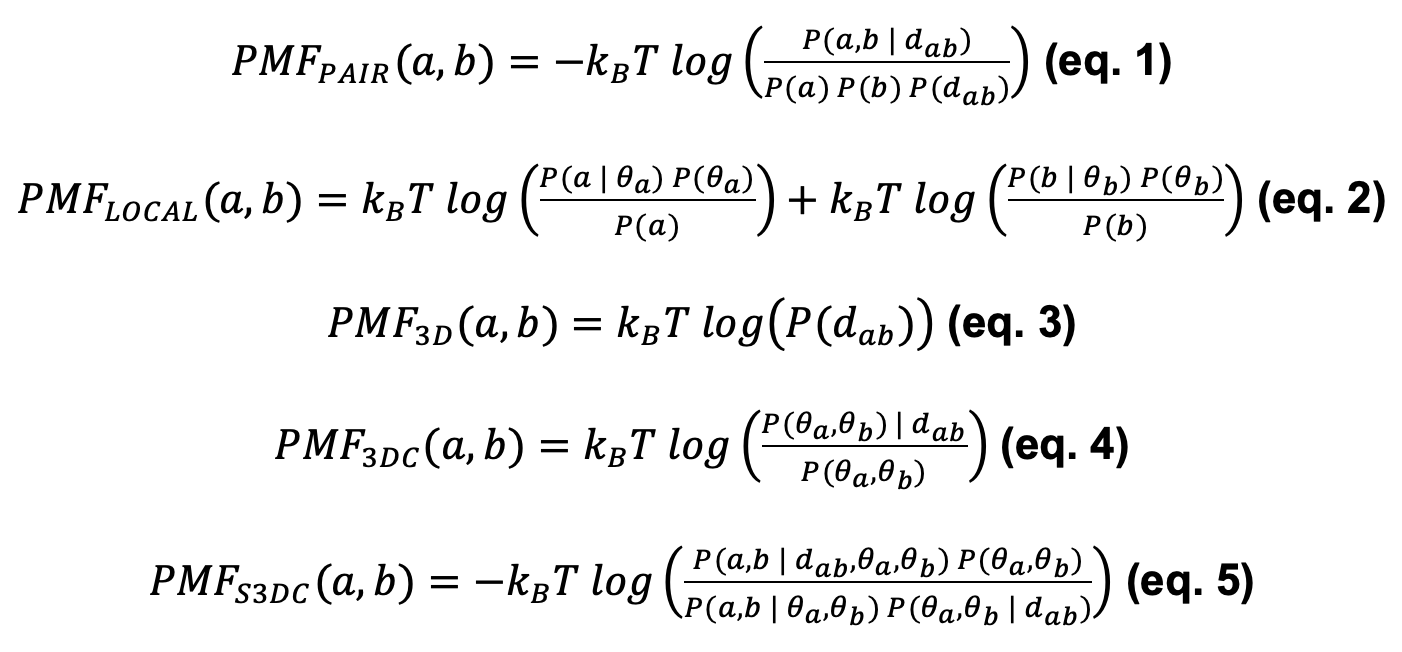
With kB the Boltzmann constant, T the standard temperature (300K), θa , and θb the features of amino acids a and b, and dab the distance between both residues. The terms P(·) denote the probabilities of observing interacting pairs (with or without conditions). For instance, P(a,b|dab) is the conditional probability that residues a,b interact at distance smaller than or equal to dab, and P(dab) is the probability of finding any pair of residues interacting at distance smaller than or equal to dab.
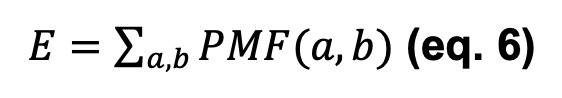
The scores PAIR, ELOCAL, E3D, E3DC, and ES3DC are obtained by summing the PMF with the corresponding subindex of each pair of interacting residues a, b, either of the same protein (for fold) or between two interacting proteins (for PPIs), as in equation 6:
We proved (3) that the classical statistic potential, PAIR, can be approximated to:

With a residual ϵ that accounts for the reference state and becomes noise centered at 0 upon normalization (i.e. when transformed in Z-scores, see further). Hence, given that E3D nullifies when normalizing the scores and ϵ is irrelevant, we define another score, ECOMB, as:

Validation
We have tested the knowledge-based potentials for two main functions: scoring protein fold models and PPI docking poses.
Performance when scoring protein fold models: We tested the fisa_casp3, Imds, 4state_reduced and MOULDER decoy datasets. We correctly assigned, with the best score, the native structure for 27 out of 43 targets. We show the ROC curves for several scoring functions differentiating incorrect from near-native models on the MOULDER (a) and 4state_reduced (b) benchmarks in the next image:
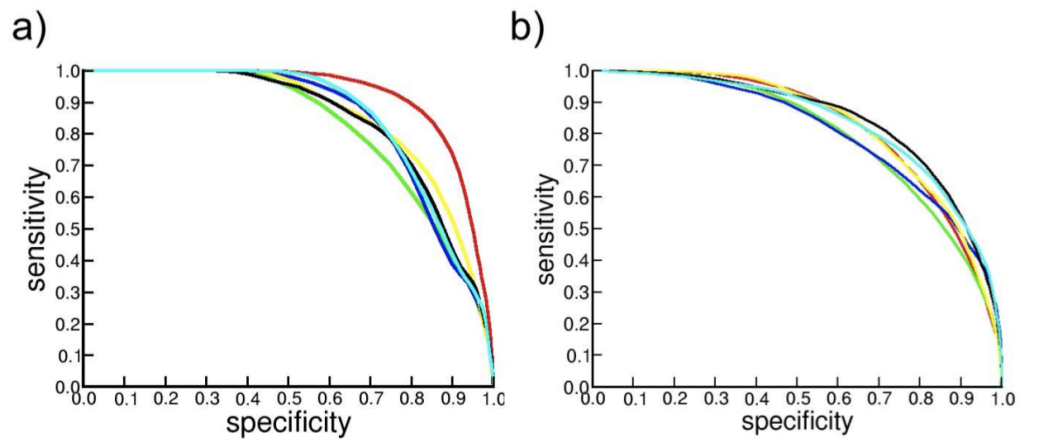
The scoring functions here represented are: Prosa2003 (red), DFIRE (green), DOPE (blue), GA341 (yellow), ZPAIRcβ (black) and ZPAIRcmin (cyan). For more information about this analysis see Aloy and Oliva (1).
Additionally, we have tested the CASP12 experiment benchmark (4). Out of 40 targets of CASP12, we identify, among the top 10 scored solutions, the native structure for 14 targets and at least one native or near-native structure for 21 targets. Furthermore, we obtain a correlation of 0.21 between the main chain atomic deviation and the split-potentials scores, proving the detection of regions that deviate from the native structure.
Performance when scoring PPI models: We tested several benchmark datasets as explained in Feliu, et al (2). In the next image, we can see the success curve for several scoring functions on two different datasets: a standard dataset of docking poses (a) and a dataset of permanent interactions (b):
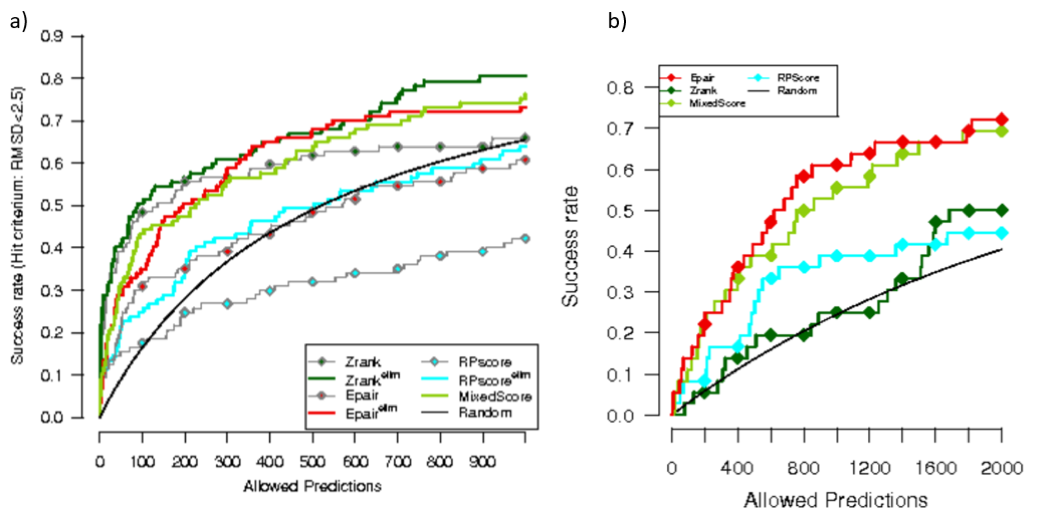
From these scoring functions, the PAIR (red) is one of the scoring functions provided by our server. For more information of this analysis see Feliu et al (2).
Additionally, we have tested the CAPRI score set benchmark (5). We identify at least one near-native or native solution among the top 10 scored poses for 9 out of 15 targets. Furthermore, we have a 21% of success identifying near-native poses.
Citation
Aguirre-Plans J, Meseguer A, Molina-Fernandez R, Marin-Lopez MA, Jumde G, Casanova K, et al. SPServer: split-statistical potentials for the analysis of protein structures and protein–protein interactions. BMC Bioinformatics. 2021; 22(1):4. doi: 10.1186/s12859-020-03770-5
References
- Aloy P, Oliva B. Splitting statistical potentials into meaningful scoring functions: Testing the prediction of near-native structures from decoy conformations. BMC Structural Biology. 2009; 9:71.
- Feliu E, Aloy P, Oliva B. On the analysis of protein–protein interactions via knowledge-based potentials for the prediction of protein–protein docking. Protein Science. 2011; Vol 20: 529-541.
- Fornes O, Garcia-Garcia J, Bonet J, Oliva B. On the Use of Knowledge-Based Potentials for the Evaluation of Models of Protein-Protein, Protein-DNA, and Protein-RNA Interactions. Advances in Protein Chemistry and Structural Biology. 2014; Volume 94.
- Kryshtafovych A, Monastyrskyy B, Fidelis K, Schwede T and Tramontano A. (2017) Assessment of model accuracy estimations in CASP12. Proteins., 1–16.
- Lensink MF, Wodak SJ. (2014) Score_set: a CAPRI benchmark for scoring protein complexes. Proteins., 82(11).
Submission
1) Analysis to run
You must specify the type of analysis that you want to run:
- Protein folds: Evaluation of the potentials of one or several protein folds.
- Protein-protein interactions: Evaluation of the potentials of one or several protein-protein interaction structures.
2) Contact definition
The program gives you the possibility to define when it is considered that two residues are in contact. There are two possibilities:
- CB-CB distance < 12 A: When the distance between the beta-carbons of the two residues is lower than 12 angstroms.
- Minimum residue-residue distance < 5A: When the distance between the two residues is lower than 5 angstroms.
3) Introduce the files
Now, you have to introduce the PDB files of the structures that you want to analyze. You can do it in different ways depending on the analysis:
Protein folds: Introduce the PDBs of the protein folds that you want to analyze either in PDB or mmCIF format, or compressed either in .tar.gz or .zip. formats
Protein-protein interactions: There are two possibilities:
- Protein-protein interaction structures in uncompressed files: Upload the structure of the interaction that you want to analyze in one file indicating the chain identifiers corresponding to the receptor and the ligand.
- Protein-protein interaction structures in compressed files: Upload the structure of the interaction that you want to analyze in separated files, indicating if the file corresponds to the receptor (.r.pdb) or to the ligand (.l.pdb).
After submitting a job, the user will be given a code to retrieve the results linked to a specific web address.
Results
To retrieve the results the user can:
- Use the code provided after the submission in the Results tab
- Save or bookmark the link assigned to the provided code
While the prediction is not finished, the Results page remains reloading.
For any question or suggestion about the SPServer, please contact us.
How to interpret split statistical potentials scores?
Statistical potentials scores represent the probabilities of having a set of amino acid contacts in a dataset of reference structures. This dataset of reference structures is made of native state structures. The probabilities of having a set of amino acid contacts in the reference dataset are represented as an energetic function. So, for the structures with amino acid contacts that happen frequently in the reference dataset, we will get low energy scores, indicating closeness to the native structure.
The fundamental statistical potential based score applied in this work is the PAIR scoring function. That is why a good criteria is to consider that the lowest the PAIR score, the closest the model is to the native structure. The statistical potential PAIR can be spitted into other terms (ES3DC, ELOCAL, E3DC and E3D). This is the formula by which the different potentials contribute to the PAIR scoring function:

Each one of these split potentials considers specific aspects regarding protein structure such as amino acid contact distance, amino acid frequency or environmental features. The contribution of these scoring functions to the overall PAIR score is different among them: some have an additive effect in the formula, some have the opposite effect. This involves that some functions indicate proper amino acid contacts by low scores (PAIR, ES3DC, ECOMB and E3D), and others do it by high scores although they have been turned negative to facilitate the analysis (ELOCAL and E3DC).
We must take into account that statistical potentials based scores are relative measurements. This means that we cannot apply a score threshold to discriminate good from bad models. They have been intended to compare models between them or with experimentally determined structures.
- PAIR and ZPAIR: These scoring functions take into account amino acid contact distance and frequency. The lowest the score, the closest to the native structure.
- ES3DC and ZES3DC: These scoring functions take into account amino acid contact distance, frequency and environmental features. The lowest the score, the closest to the native structure.
- ELOCAL and ZELOCAL: These scoring functions take into account environmental features. The lowest the score, the closest to the native structure.
- E3DC and ZE3DC: These scoring functions take into account the distance between different environmental features. The lowest the score, the closest to the native structure.
- E3D: This scoring function takes into account the distance between amino acids. The lowest the score, the closest to the native structure.
- ECOMB and ZECOMB: These scoring functions are a combination of the ELOCAL and the E3DC scoring functions. Therefore, they take into account the environmental features of proteins and also the distances between these different environments. The lowest the score, the closest to the native structure.
To which scoring function should we pay more attention?
This depends on what are you interested in. To assess the global protein folding, the more appropriate functions are the PAIR and the ES3DC. To assess more specific aspects from protein structure, such as the secondary structure and other environmental features you can use:
- ELOCAL and ZELOCAL: To assess the correct assignation of environmental features in the model. This includes the proper assignation of secondary structures, the degree of exposure and the polar character for each amino acid.
- E3DC and ZE3DC: To assess the correct assignation of distances between specific protein environments. This takes into account the secondary structure, the polar character and the degree of exposure from all amino acids in the model.
- ECOMB and ZECOMB: The ECOMB score results from a combination of the ELOCAL and the E3DC score. Therefore, it has been designed to specifically assess the assignation of environments to amino acids in protein models.
How to identify wrongly folded protein regions?
It may be the case that one protein model has a well modeled region and a wrong modeled region. In such cases, it is not recommendable to draw conclusions from the global scores. It is better to check the score profile and identify which regions have good or bad scores. By removing or correcting the regions of the model with poor scores we will obtain a more reliable protein structure.
How to compare two protein-protein interaction structures?
To do so, you must submit two or more structures to the server. Once in the results page, you have to select the “inspect ppi details” option. Then, you have to assign to one of the structures the “up” label, and to the other the “down” label. This is done in the “protein-protein interactions to inspect” section. Protein contacts for the “up” structure are represented with small squares, while the “down” structure ones are represented with big hollow squares. When the same contact is found in both structures, the two squares that represent them fit. By selecting the colors of the plot you can identify which score corresponds to each structure and compare them.
How does the sliding window work?
The sliding window tool in the “residue scores” section smooths the score curve by assigning to each residue the average value of the neighboring amino acids. The largest the window value, the highest the number of residues that will be averaged, which will increase the smoothening of the curve.
How to cite SPServer?
Aguirre-Plans J, Meseguer A, Molina-Fernandez R, Marin-Lopez MA, Jumde G, Casanova K, et al. SPServer: split-statistical potentials for the analysis of protein structures and protein–protein interactions. BMC Bioinformatics. 2021; 22(1):4. doi: 10.1186/s12859-020-03770-5