Introduction
GUILDify is a web server for phenotypic characterization of genes through biological data integration and network-based prioritization algorithms. Towards the goal of extending our knowledge on the genetic elements underlying various phenotypes (including but not limited to disease phenotypes), we aim to use gene-phenotype associations in combination with the network-based prioritization methods. Considering the lack of convenient interfaces that bridge many of network-based prioritization algorithms to end users, we present GUILDify, an easy to use web server that assigns genes likelihood scores of involvement for a given keyword (e.g. disease phenotype, functional annotation or in broader terms any phenotypic association) using integrated data from publicly available major biological data repositories (see BIANA and GUILD). The databases integrated by BIANA are referred as BIANA-KB (BIANA knowledge base).
Schematic overview
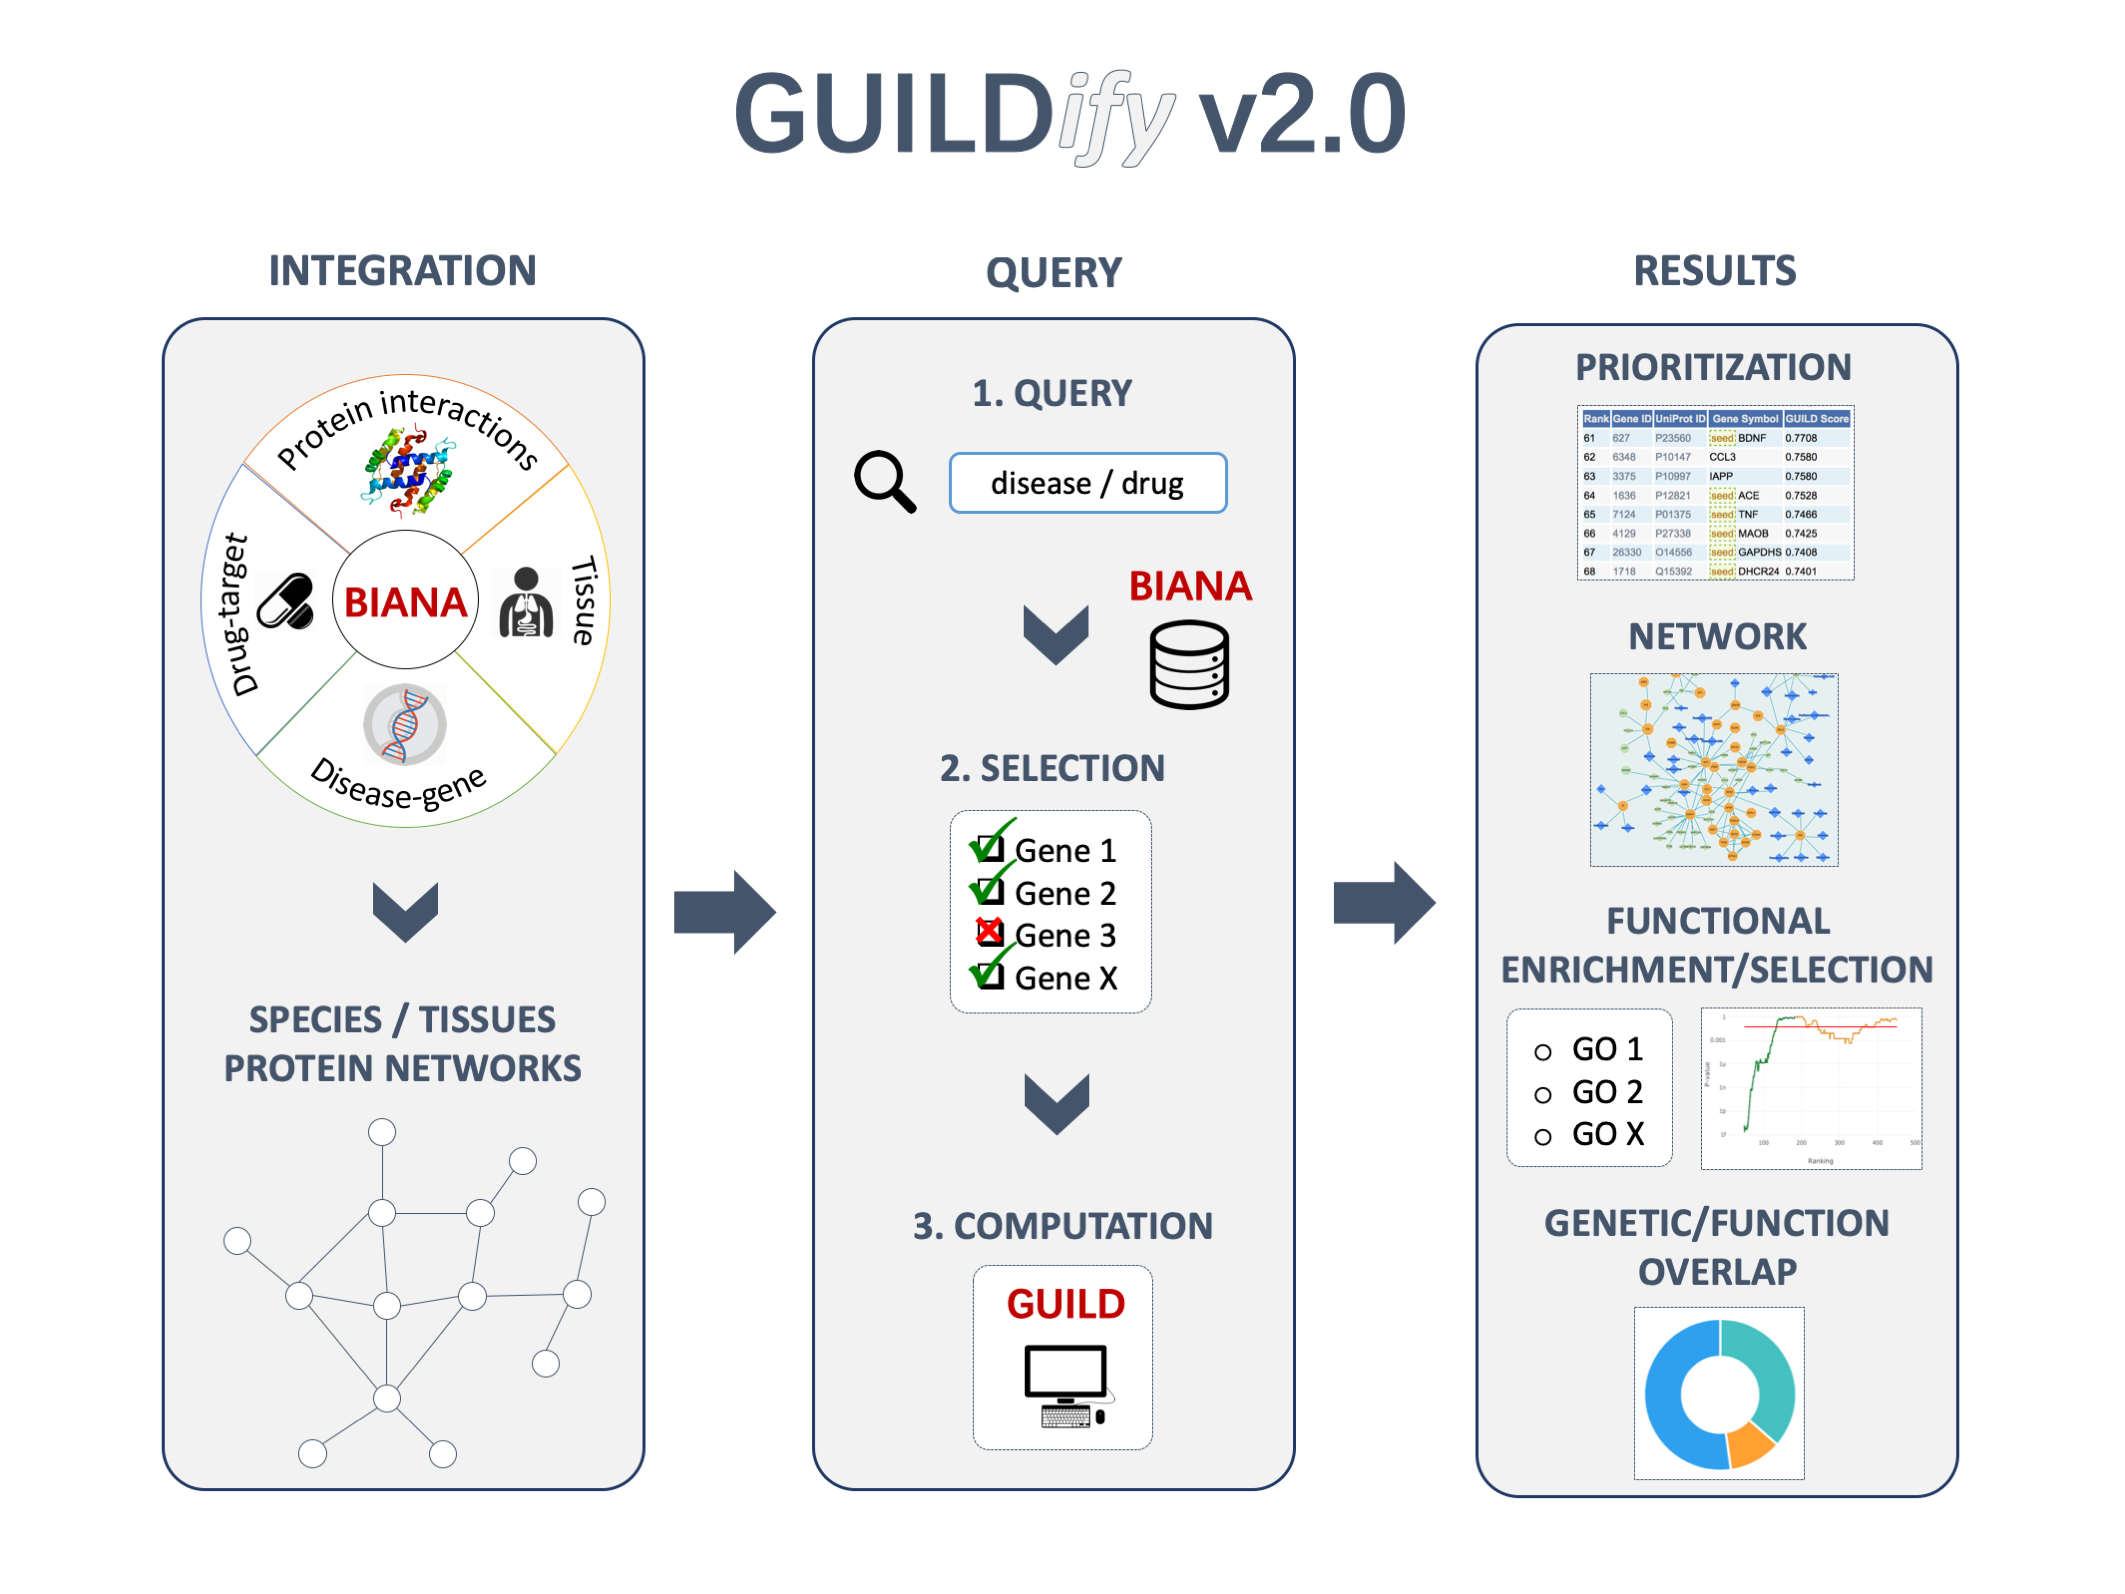
Usage
1- Input
1.1- Keywords / Gene symbols
The input form on the home page (shown with A in the figure below), accepts any keyword (or a combination of them) describing a phenotype (i.e. disease, biological function or pathway). A user-provided list of genes can also be queried given that they are separated by semicolons (e.g., "BRCA1;BRCA2").
- KEYWORDS describing a phenotype:
The user can provide either a keyword or a combination of keywords describing the phenotype. There are several options to make the query of multiple keywords:-
Grouping multiple keywords TOGETHER using quotations:
When the keywords are quoted together, GUILDify will only match entries that contain the quoted keywords together in their description. For instance, "lung carcinoma" (with quotation) will retrieve entries containing "lung carcinoma" together. -
Searching for a keyword AND another keyword using '+':
If we want to search entries containing multiple keywords but not necessarily together, we have to add '+' in front of the word. For instance, "+alzheimer +diabetes" will retrieve entries containing "alzheimer" AND "diabetes". -
Searching for a keyword OR another keyword using whitespaces:
If we want to search entries containing at least one of the keywords specified, we have to separate them using whitespaces. For instance, "alzheimer diabetes" will retrieve entries containing "alzheimer" OR "diabetes".
-
Grouping multiple keywords TOGETHER using quotations:
- User-specified GENE SYMBOLS using semicolons (';'):
If the query contains ';', it will be considered as a list of genes separated by semicolons (e.g., TP53; BRCA1; BRCA2). - User-specified GENE SYMBOLS uploaded in a file:
The users can specify their own gene symbols easily by uploading them in a file, separated by new lines ("\n").
There are examples of queries in E of the figure below.
1.2- Species and tissues
Below the query box, there is a panel (i.e. B in the figure) where the user can select the species of the protein-protein interaction network used. Currently the following species are supported: "Homo sapiens", "Mus musculus", "S. cerevisiae", "C. elegans", "D. melanogaster", "A. thaliana" .
In the case of "Homo sapiens", the user can also select the tissue of interest. Currently, there are 22 different types of tissues supported.
1.3- Network source (optional)
Optionally, the user can click at "More options" (i.e. D in the figure) where it is possible to change the protein-protein interaction network. By default, the network made using an integration of different sources with BIANA is selected. However, the user can select different network sources: "HIPPIE", "InBio_Map", "ConsensusPathDB", "I2D", "STRING".
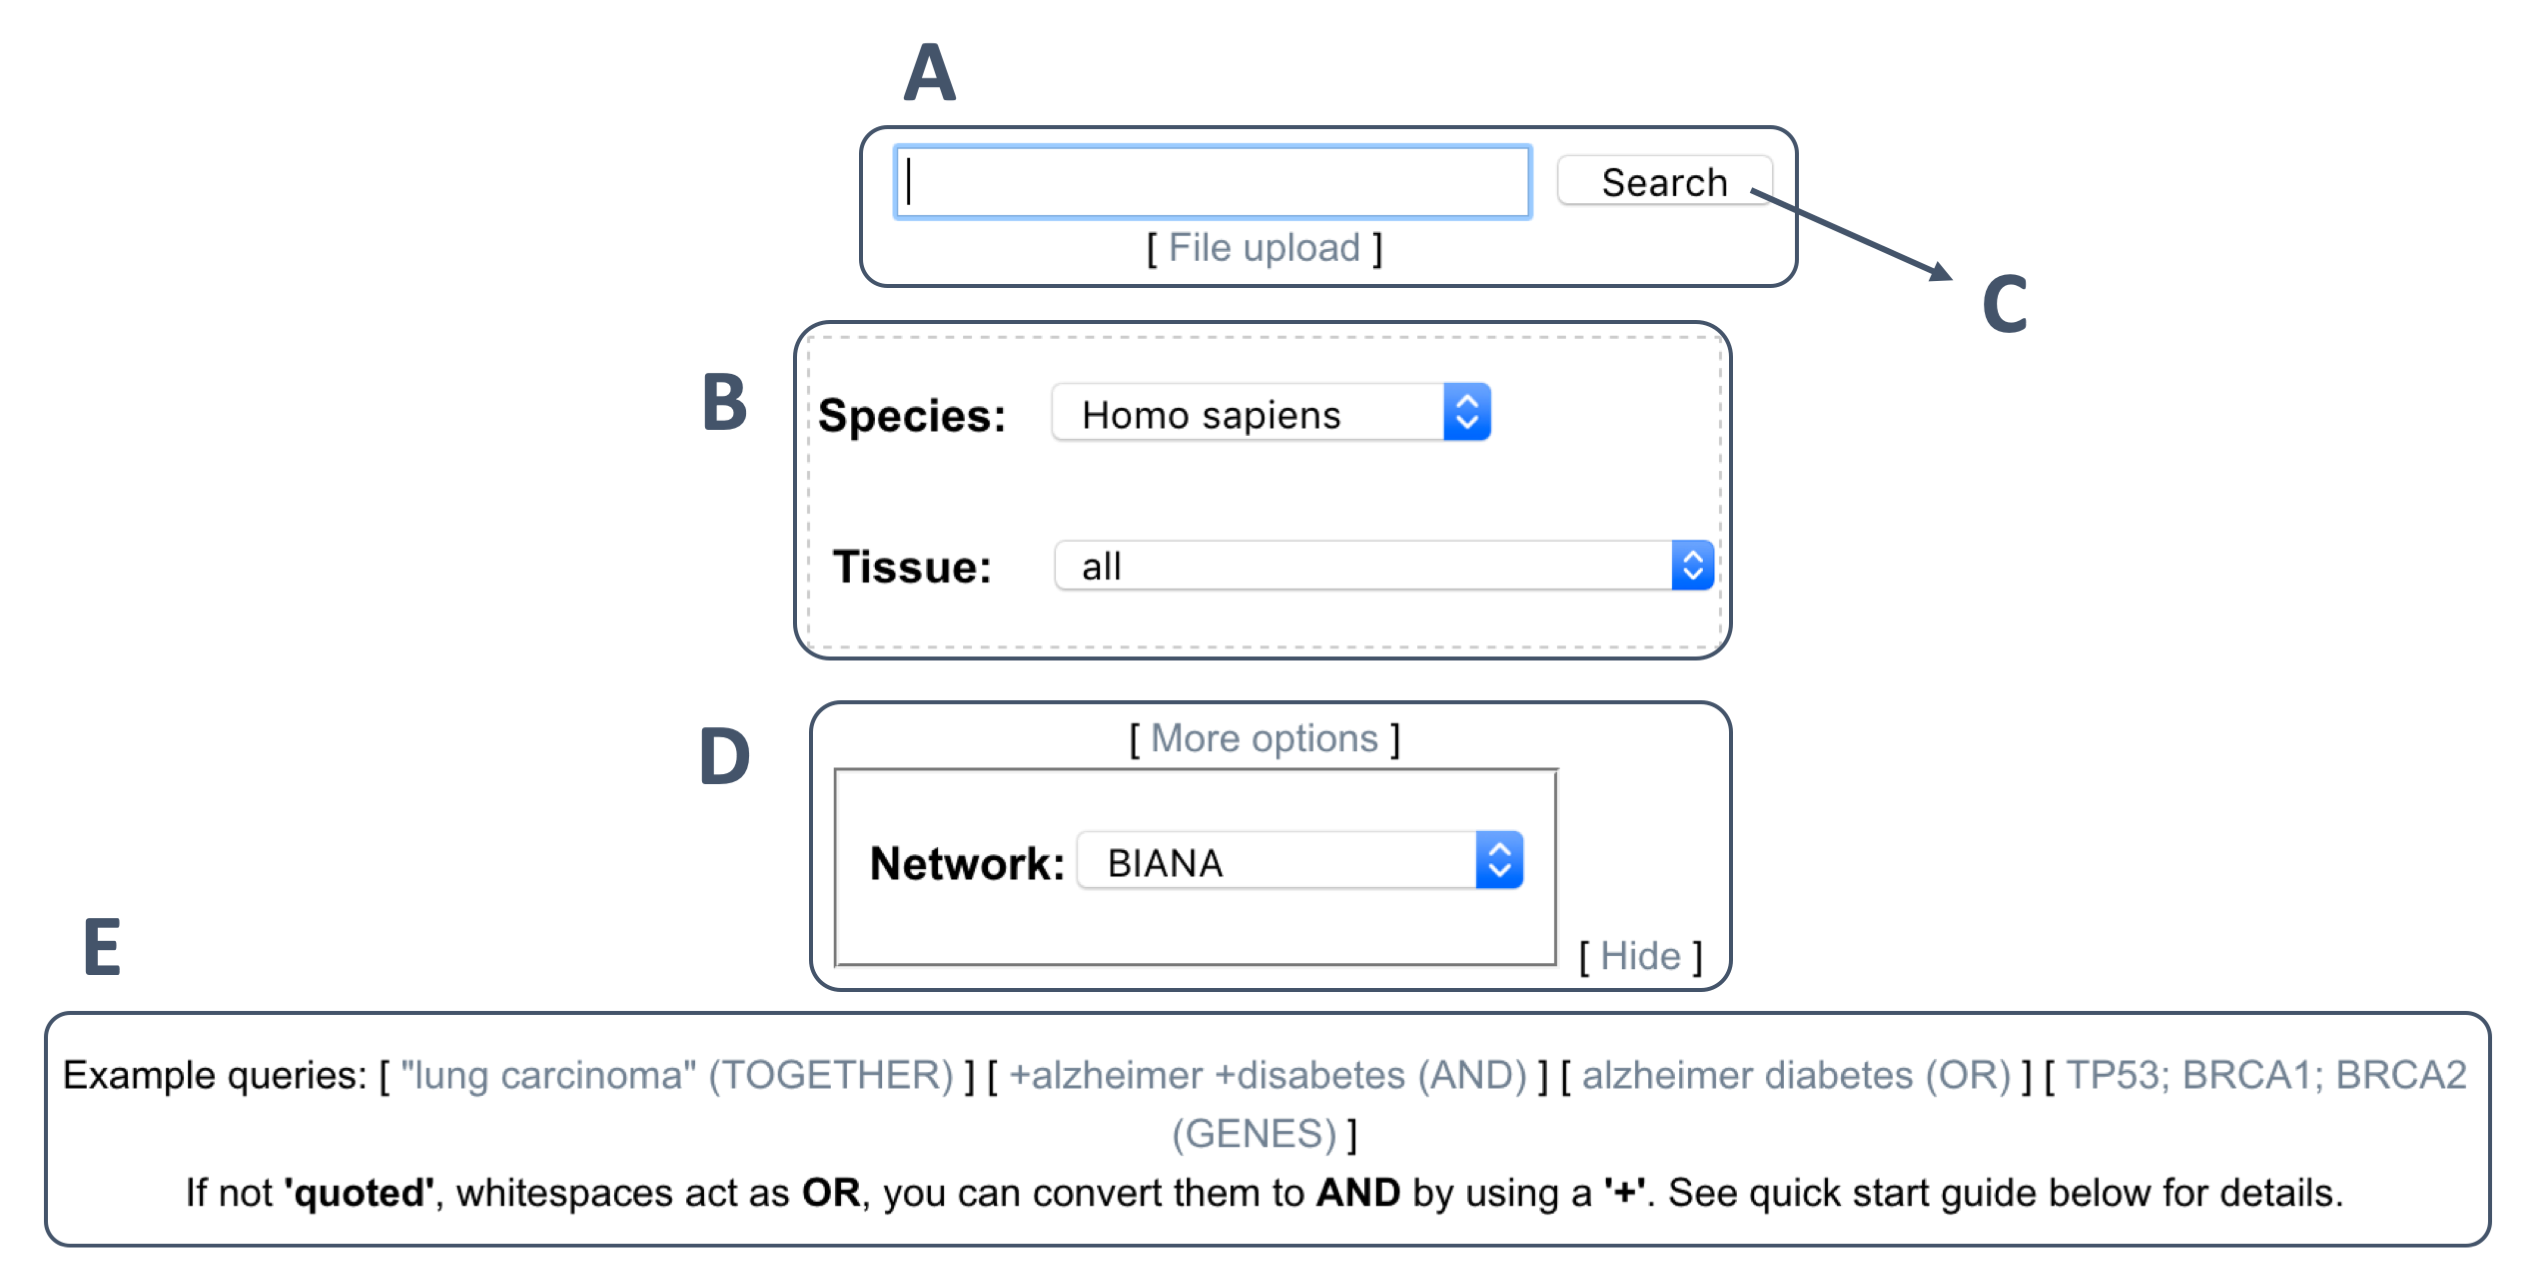
Once the keywords are entered and the species is selected, the user can proceed by clicking "Search in BIANA Knowledge base" button (C above).
1.4- Selection / Filtering of genes
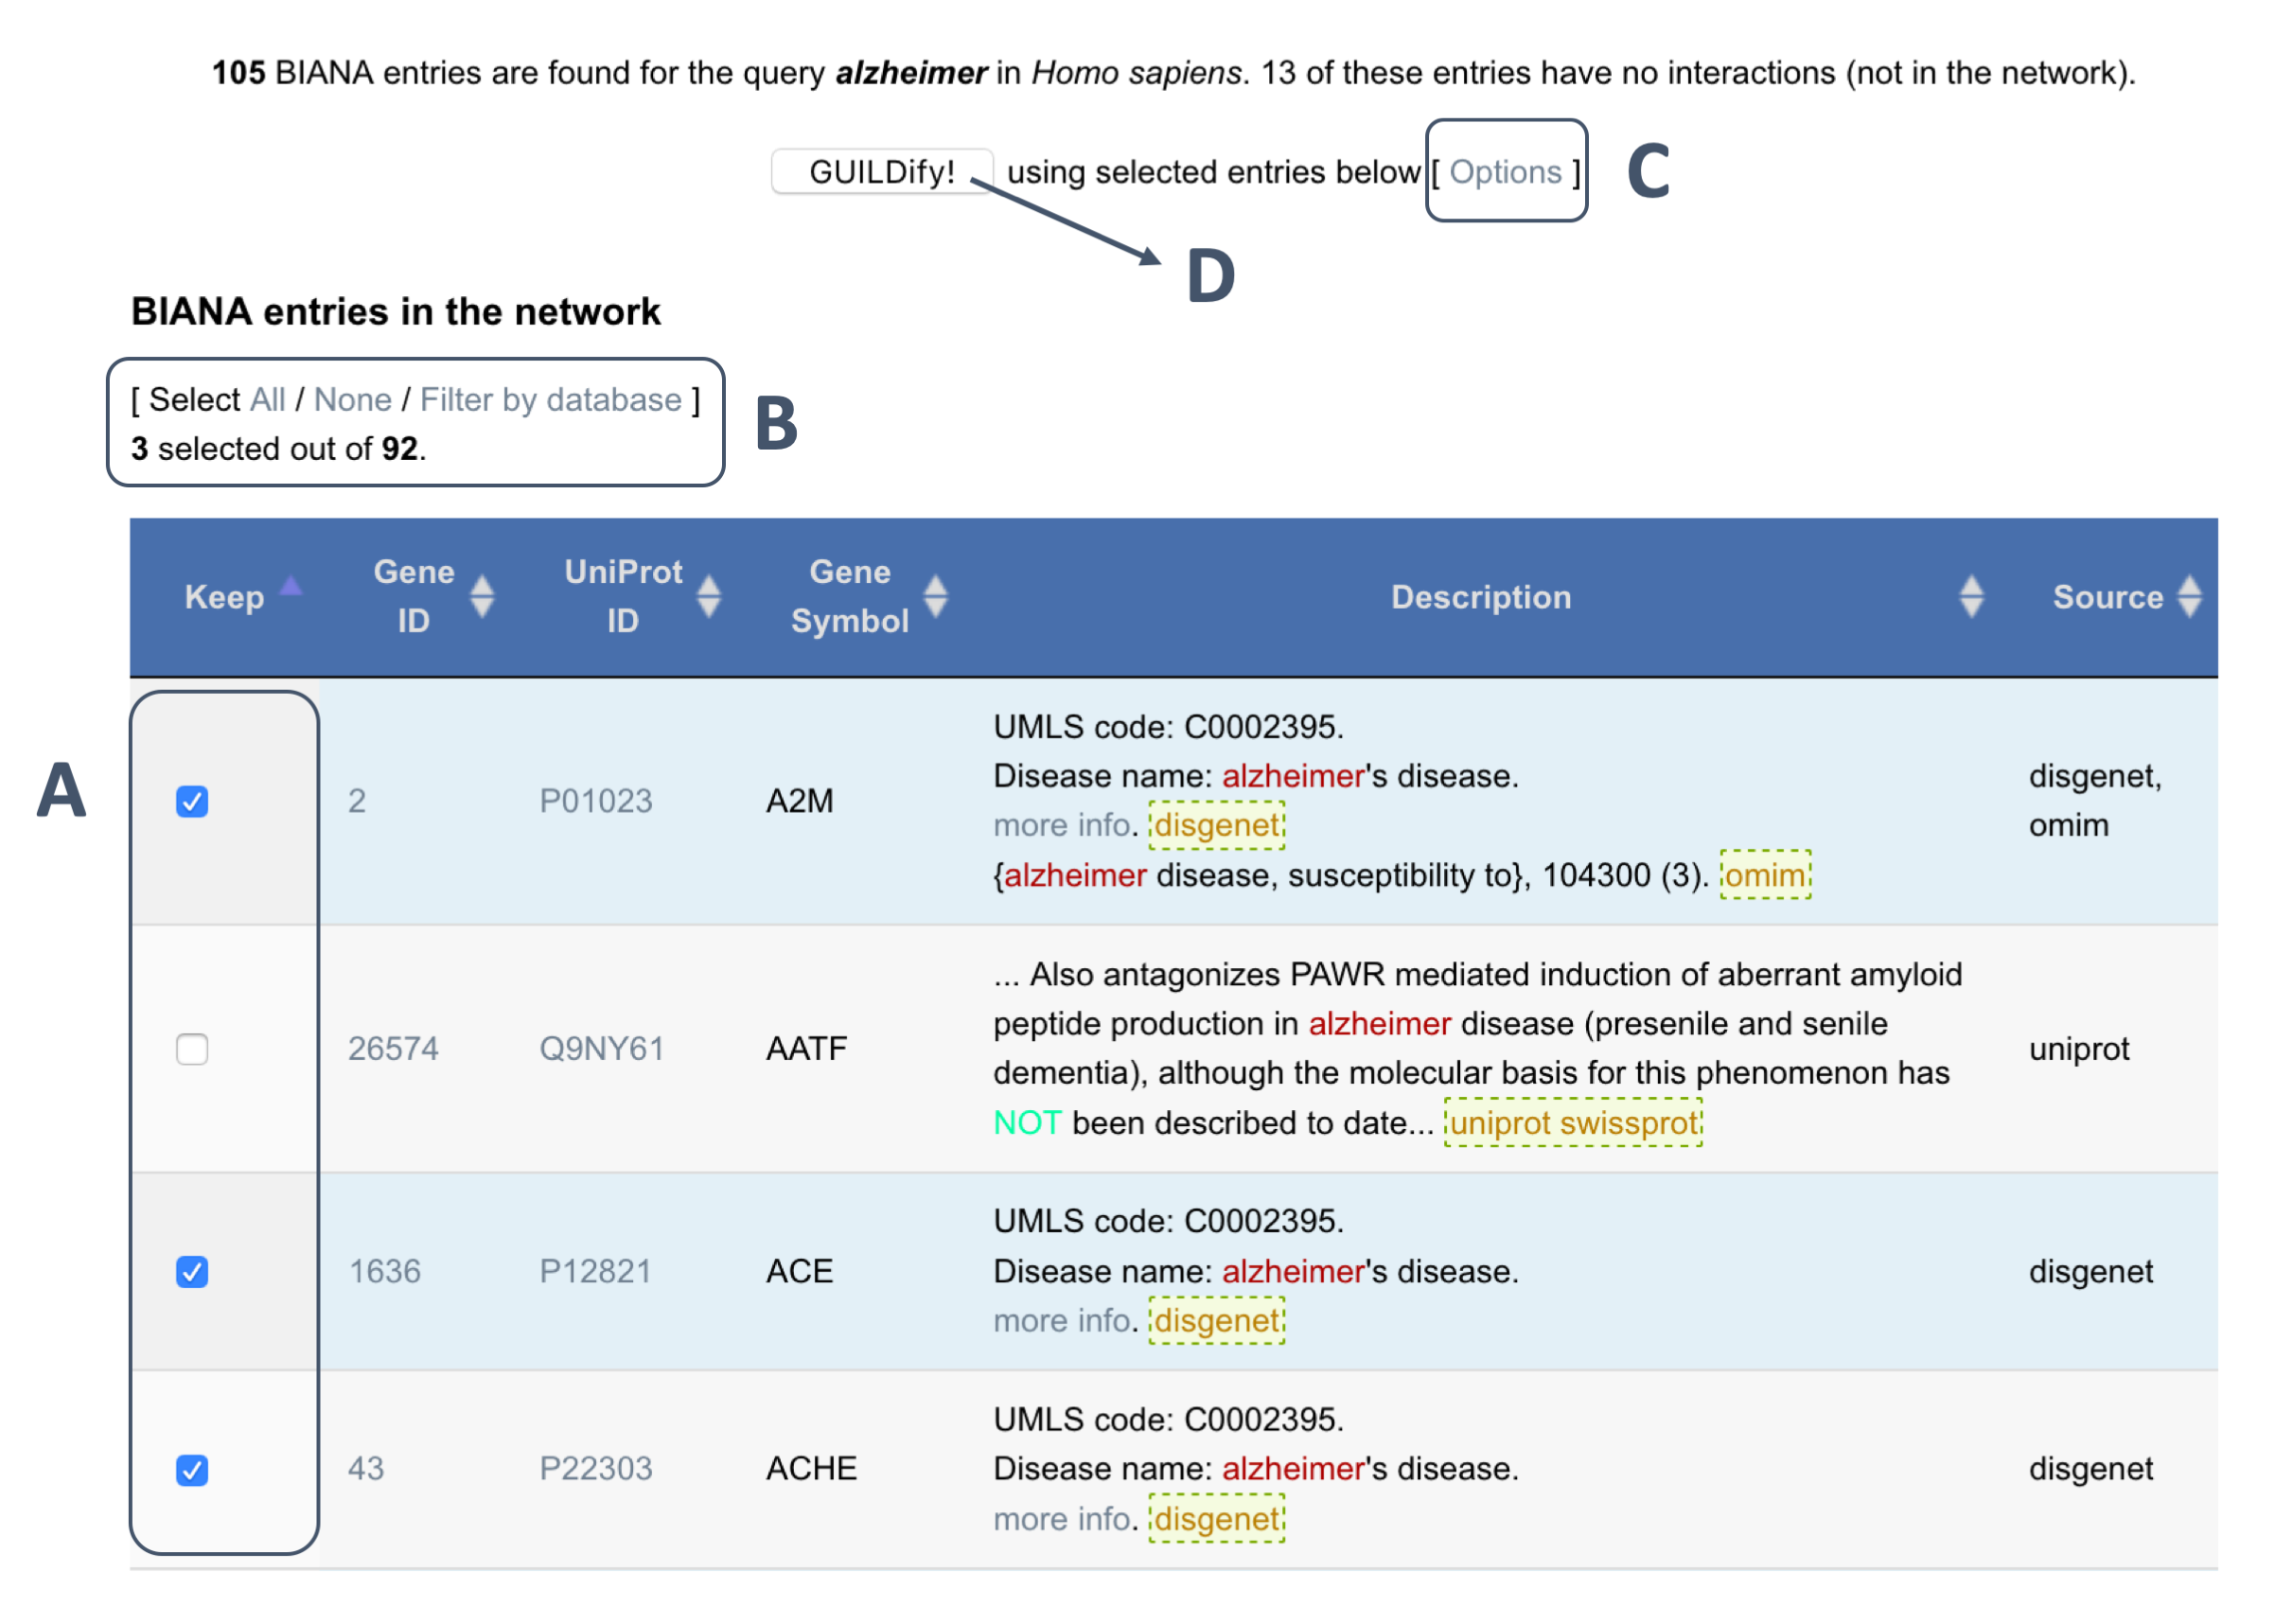
The user may further select which genes to include on the same page by clicking to the check boxes next to the listed entries under the "Keep" column (shown in A of the image below). The user has also the possibility to filter the genes by the source from which they come (see B in the image below).
1.5- Selection of algorithm and computation
Finally, the user can select the algorithm to run GUILDify (see C in the image below). By default, the algorithm used is NetCombo (a combination of NetScore, NetZcore and NetShort algorithms). Then, the user can click to GUILDify and the computation will start (see D in the image below).
GUILDify is designed to be as simple as possible. Many algorithmic details such as internal parameters used by the scoring algorithms are hidden from the user. These parameters are chosen the values that are shown to be optimum on a large data set of disease phenotypes under the context of GUILD project. Users that are interested in using user-defined parameters are advised to refer to download stand-alone software provided in the aforementioned web page.
2- Status page
The status page provides the links for the result page. This link is going to be available as soon as the scores are calculated by the server. The running time of the job depends on several factors (algorithm selected, number of seeds selected, number of jobs in queue...). In the status page, we can find progress bar giving an approximation of how much time each algorithm takes to calculate the scores. The ranges would be of:
- NetScore: 5 to 10 minutes
- NetZcore: 5 to 10 minutes
- NetShort: 10 to 20 minutes
- NetCombo: 10 to 20 minutes
- DIAMOnD: 5 minutes
- No prioritization: 1 minute
3- Output
3.1- Ranking of genes associated to the phenotype
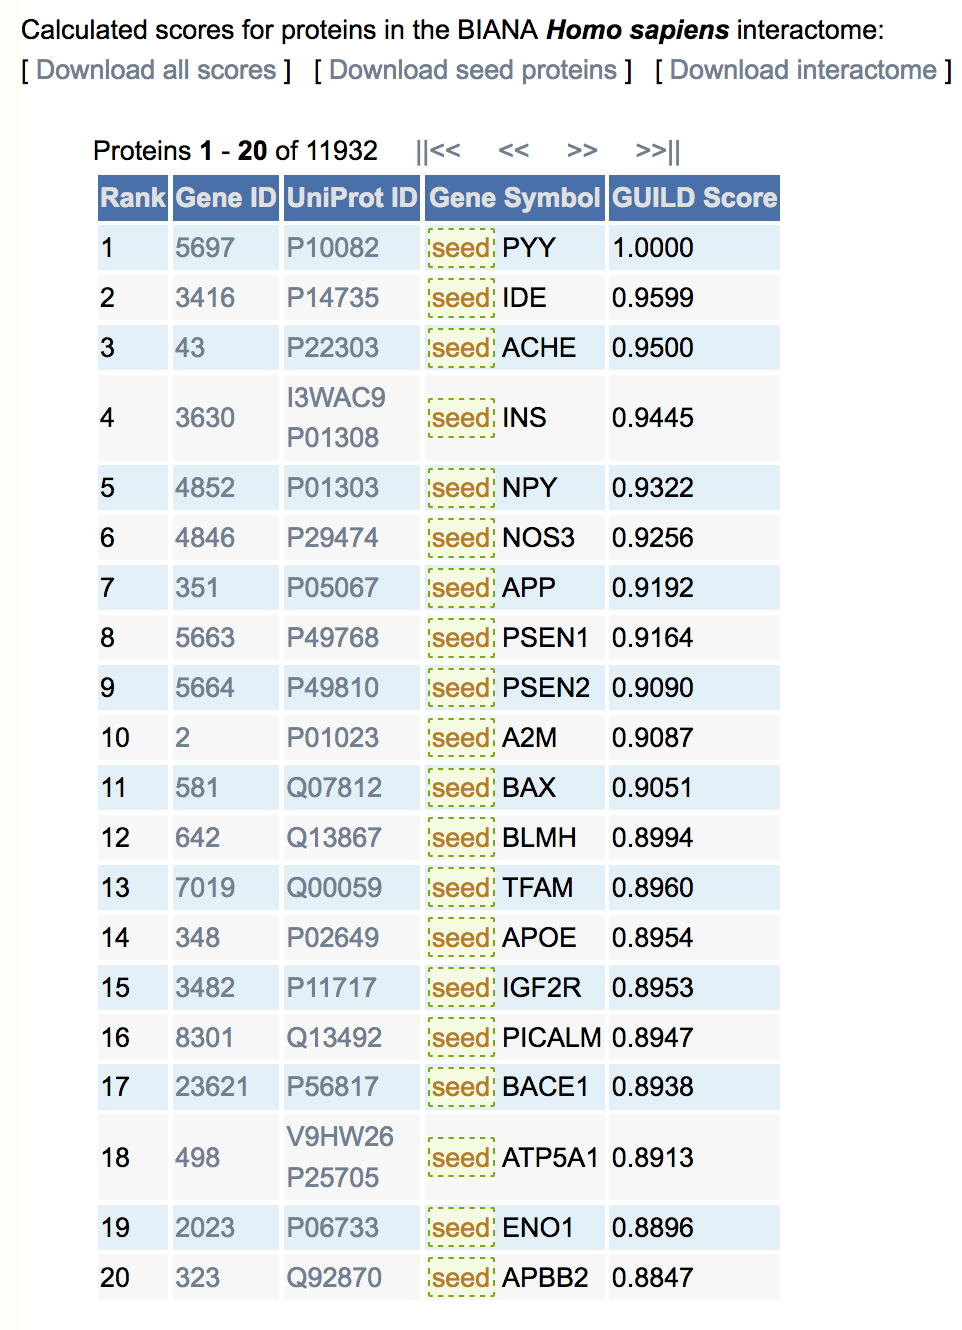
For each gene product in publicly available databases integrated by BIANA, we provide a likelihood score associating the gene product with the phenotype provided by the user. The likelihood score is the final column in the result table (GUILD Score, shown in the image below). The files containing GUILD Scores of all gene products and seed proteins used in the scoring method can be both downloaded using "Download all scores" and "Download seed proteins" links respectively. The interactome network can also be downloaded using "Download interactome" link.
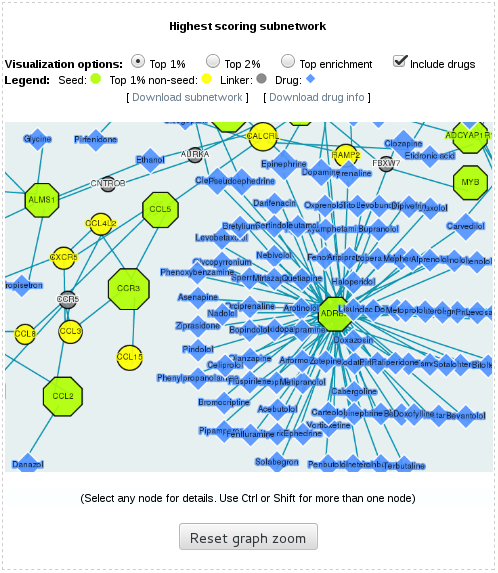
3.2- Visualization of the top-ranking subnetwork
GUILDify also provides an interactive visualization panel for displaying the interactions in the highest scoring subnetwork (highest scoring 1%, 2% and enriched proteins, and their interactions, see images below). If the species if Homo Sapiens, GUILDify fetches drugs from DrugBank and includes them in the visualization panel. The nodes can be selected in the visualization panel. The information for the selected nodes will be displayed at the bottom of the panel. The drugs can be filtered using the "Include drugs" checkbox. The highest scoring subnetwork and the information on drugs (if the species is Homo Sapiens) can be downloaded using "Download subnetwork" and "Download drug info" links respectively.
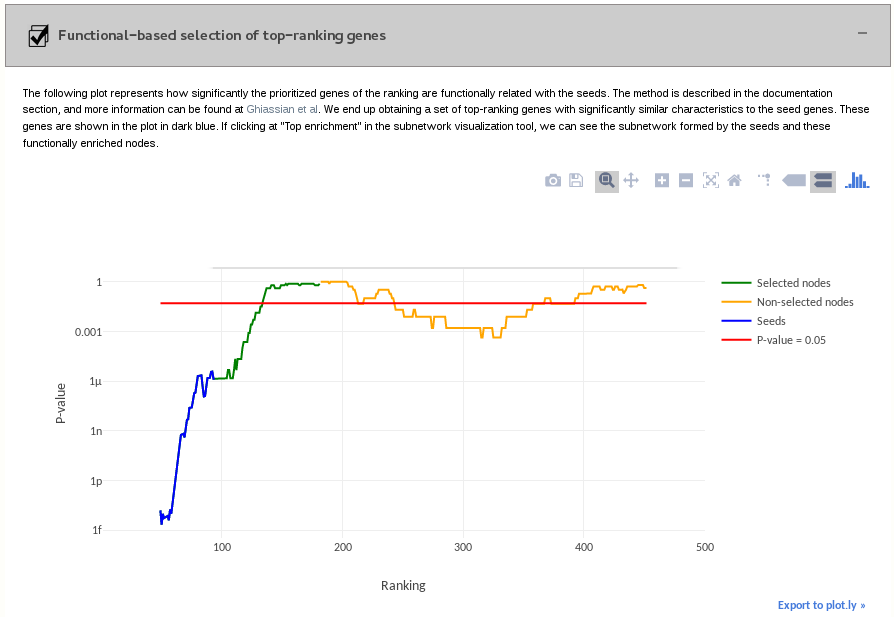
3.3- Functional-based selection of top-ranking genes
Defining a cut-off to select the most relevant prioritizated genes is not a trivial problem. To solve it, we have implemented a method to identify top-ranking genes with significantly similar characteristics to the set of initial seed genes. The procedure was first implemented in Ghiassian et al.
First, we find the enriched Gene Ontology (GO) terms in our seeds by calculating a hypergeometric test. We only use high confidence annotations associated with the evidence codes EXP, IDA, IMP, IGI, IEP, ISS, ISA, ISM or ISO. From the enriched GO terms, we identify the ones that are significantly enriched using Fisher’s exact test (FDR Benjamini-Hochberg corrected p-value < 0.05). For each candidate gene in the top-ranking genes, we search if it is annotated within any of the significant GO terms of the seeds. The genes annotated are considered true positives.
We define a sliding window with a size corresponding to the number of seeds on each candidate gene in the ranking. For instance, if there are 66 seeds, the interval will be [i-66/2, i+66/2]. We calculate the number of true positives among the proteins in the sliding window. We calculate the statistical significance in the sliding window by using the Fisher’s exact test.
In the end, we obtain a plot that goes from the first position of the sliding window (ranking = number of seeds/2 + 1) to the final position (500 - nº of seeds/2). In each position, we show the result of the Fisher’s test calculation for the positions of the sliding window. We considered as enriched positions the positions of the last (non-seed) sliding window giving a p-value < 0.05 and the previous positions.
We end up obtaining a set of top-ranking genes with significantly similar characteristics to the seed genes. These genes are shown in the plot in dark blue. If clicking at "Top enrichment" in the subnetwork visualization tool, we can see the subnetwork formed by the seeds and the functionally enriched nodes.
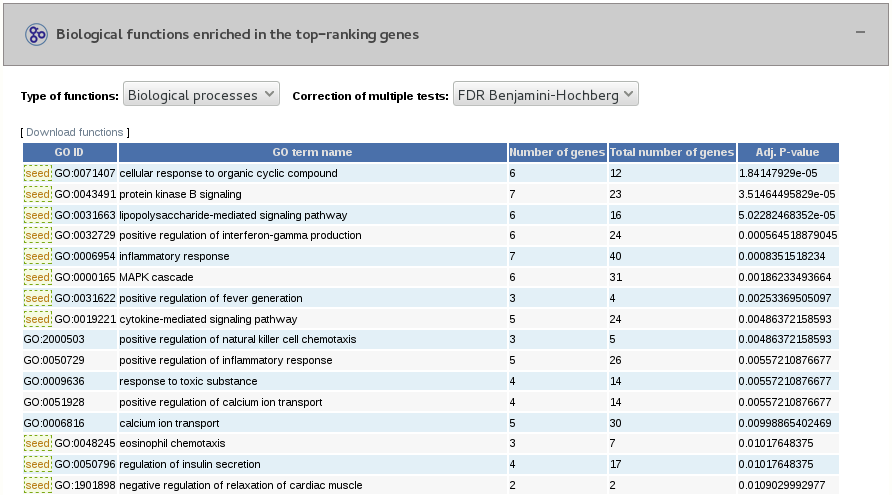
3.4- Functional enrichment analysis of the top-ranking genes and seeds
We calculate the functional terms enriched in our seeds and top-ranking proteins by using a hypergeometric test. We either use GO biological functions, GO molecular functions or Reactome pathways. We only use high confidence GO annotations associated with the evidence codes EXP, IDA, IMP, IGI, IEP, ISS, ISA, ISM or ISO. From the enriched GO terms, we identify the ones that are significantly enriched using Fisher’s exact test (FDR Benjamini-Hochberg or Bonferroni corrected, p-value < 0.05).
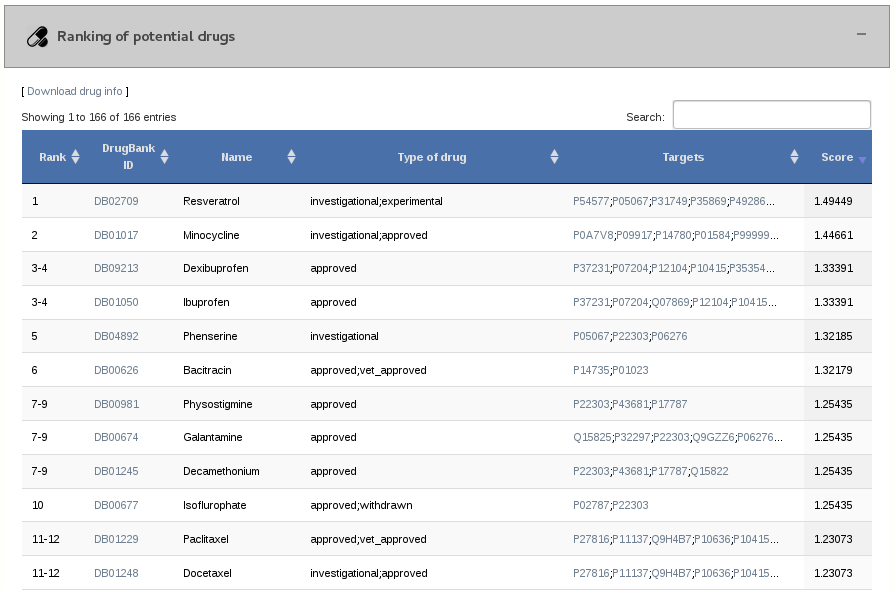
3.5- Ranking of potential drugs
GUILDify also assigns a score to the drugs associated to proteins in the human protein-protein interaction network. The drugs are ordered in a ranking of potential drugs.
Additional features
1- Identifying genetic and functional similarities across diseases
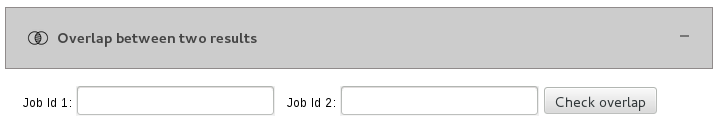
The update includes an innovative feature which permits to check the genetic overlap between the top-ranking genes and the enriched biological functions of two jobs. In the home page, we have a panel in which we can introduce the job IDs of two finished jobs, and by clicking at the "Check overlap" button we will be redirected to a page where we will see the overlap results.
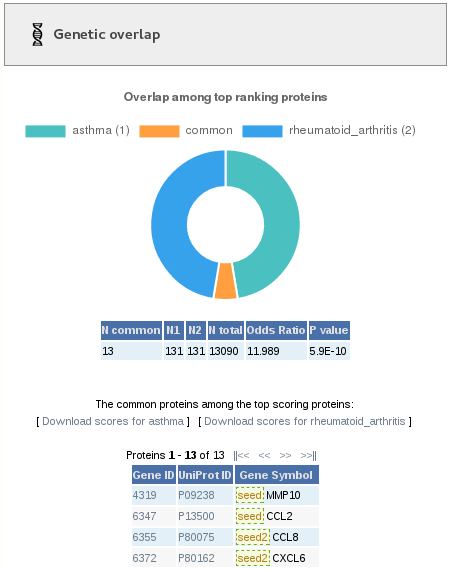
1.1- Genetic overlap
In the left part of the page, we can see the results of the genetic overlap. First, we see a doughnut plot showing graphically the overlap of genes between the two jobs. Below, we see a table containing the significance of the overlap. "N common" is the number of common top-ranking genes, "N1" and "N2" are the total number of top-ranking genes in the two jobs, "N total" is the total number of genes in the network, "Odds ratio" is the result from the Fisher's exact test, and "P value" is its significance. Below, we have a table with the information of the common genes.
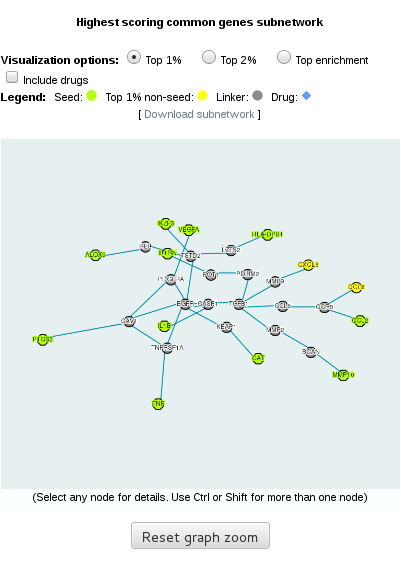
1.2- Visualization of the common top-ranking subnetwork
In the right part of the page, we can see the subnetwork formed by the common top-ranking proteins. In human, we also have the option to see the drugs targeting the proteins.
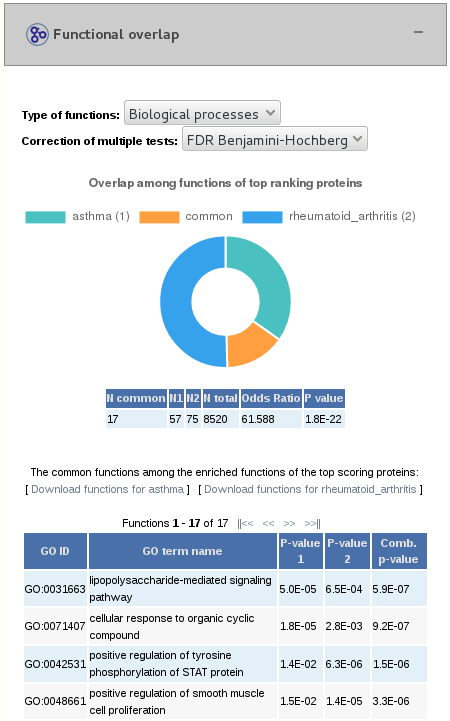
1.3- Functional overlap
In the bottom part of the page, we find the results of the common biological functions enriched from the top-ranking genes of the two jobs. We see a doughnut plot of the overlap of functions. We also have a table containing the significance of the overlap, in which "N total" is the total number of GO terms for the species. Finally, we have a table with the information of the common GO terms.
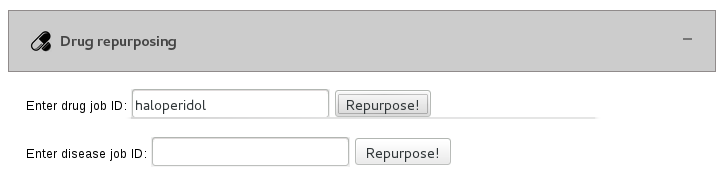
2- Drug repurposing
GUILDify v2.0 offers a new drug repurposing feature. Given a job ID associated with a drug (or a list of drug targets), this feature automatically calculates the overlap between genes (or functions) in the neighbourhood of the drug and in the neighbourhoods of a list of pre-calculated diseases. In the home page, we have a panel in which we can introduce the job ID of a finished drug job, and by clicking at the "Repurpose!" button we will be redirected to a page where we will see the drug repurposing results. The same can be applied in the opposite direction by supplying the job ID of a disease.
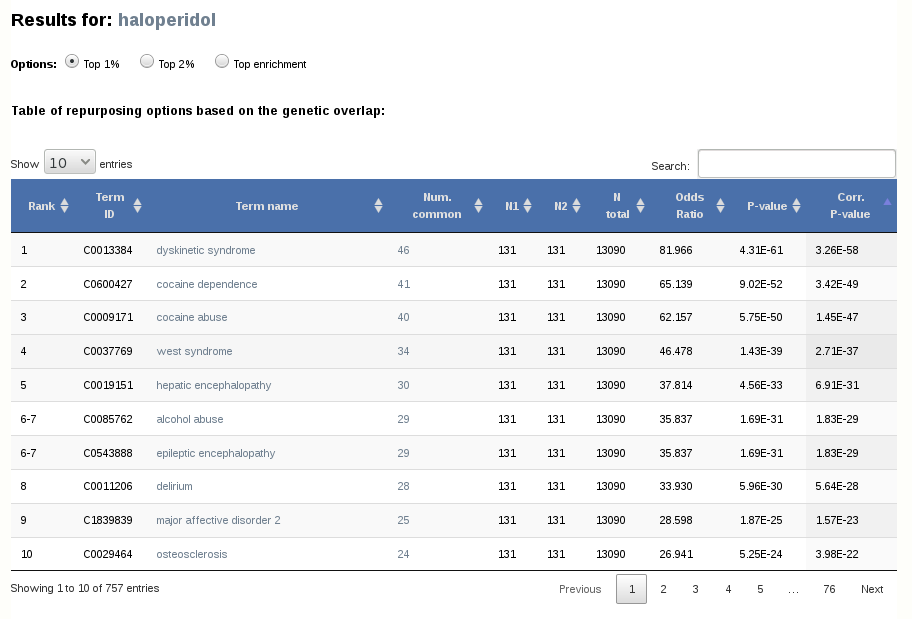
2.1- Table of repurposing options based on the genetic overlap
In the upper part of the results page, we can see a table of the ranking of diseases based on the genetic overlap with the drug. "N common" is the number of common top-ranking genes, "N1" and "N2" are the total number of top-ranking genes in the two jobs, "N total" is the total number of genes in the network, "Odds ratio" is the result from the Fisher's exact test, "P value" is its significance and "Corr. value" is the corrected p-value after applying a Benjamini-Hochberg correction of multiple tests.
2.2- Table of repurposing options based on the genetic overlap
Below the table based on the genetic overlap, we find a table of the ranking of diseases based on the functional overlap with the drug. "N common" is the number of common top-ranking genes, "N1" and "N2" are the total number of top-ranking genes in the two jobs, Here, "N total" is the total number of GO terms for the species.
3- Tissue specific protein-protein interaction networks
The tissue-specific networks are made by filtering the human protein-protein interaction network and leaving only the interactions which happen at the tissue considered. We have used GTEx V7 RNAseq gene expression values.
Frequently Asked Questions
1- How does GUILDify retrieve initial phenotype-gene associations via free text search on biological databases?
In GUILDify, the query is tokenized into keywords and then description fields in UniProt, OMIM and GO are searched for an exact match of these keywords. Quotations can be used to specify the behavior of matching when a combination of keywords is used. For instance, the query "Alzheimer disease" is first tokenized into alzheimer and disease (case insensitive). Then only the entries for which the description field contains both Alzheimer and diseases words (not necessarily consecutive) are retrieved since they are quoted together. If the same query is made without quotations, it would retrieve the entries that have either "alzheimer" or "disease".
2- Why are some Gene Ids missing from the nodes presented in the tables and visualization section?
In these cases, there is no Gene Id associated with the protein product in the original source database (UniProt). That is, the protein entry in UniProt does not map to any RefSeq protein and thus it is not possible to have a Gene Id cross-reference (See UniProt FAQ on this issue ).
3- How are the drugs prioritized? Are all proteins used for prioritization of drugs?
All proteins in the top high-scored subnetwork are used for prioritizing drugs, however most drugs have only one target (protein that is known to interact with the compound). The drugs are listed in the table, when nodes are selected in the Cytoscape-web visualization panel, and also in the downloadable tables. Drugs are ranked/scored according to the scores of their targets in the subnetwork. This also implies their association with seeds (nodes that have the highest scores), therefore the information about drugs associated with seeds come first in the table.
4- In the visualization of highest scoring subnetwork, could the size of the network diagram be increased?
The user can increase the size of the graph using the mouse zoom. The zoom can be reseted by clicking the button below the graph.
5- How to cite us?
The manuscript of the new version is already available and can be cited as follows:
- Joaquim Aguirre-Plans, Janet Piñero, Ferran Sanz, Laura I. Furlong, Narcis Fernandez-Fuentes, Baldo Oliva, Emre Guney; GUILDify v2.0: A tool to identify the molecular networks underlying human diseases, their comorbidities and their druggable targets. J Mol Biol. 2019 Jun 14;431(13):2477-2484. PMID: 30851278.
- Emre Guney, Javier Garcia-Garcia, Baldo Oliva; GUILDify: a web server for phenotypic characterization of genes through biological data integration and network-based prioritization algorithms, Bioinformatics, Volume 30, Issue 12, 15 June 2014, Pages 1789–1790, https://doi.org/10.1093/bioinformatics/btu092